Research / Data Visualization

Below the Fold — A New York Times X-Ray Dashboard

An interactive dashboard that analyzes New York Times coverage since 2000 using the NYT Archive API, with views for reporters, beats, sections, subjects, geography, obituaries, and corrections.

Clear26/30
Useful28/30
Specific17/20
Complete18/20
Below the Fold — A New York Times X-Ray Dashboard screenshot

Why it was accepted

The page clearly presents a real, data-backed research tool with a defined audience and methodology. It explains the data source, coverage scope, update cadence, and several analysis views, giving enough evidence for a useful public listing.
Weakness

The snapshot does not show whether the dashboard supports downloads, filters, or direct export of results, and some parts of the visible text are truncated so the full feature set is not fully visible.

Review status

72 days ago #86 ↑ +274

Last evaluated 72 days ago. Current rank #86. Up 274 spots in the rankings.

Score history

828488908484838689

Related listings

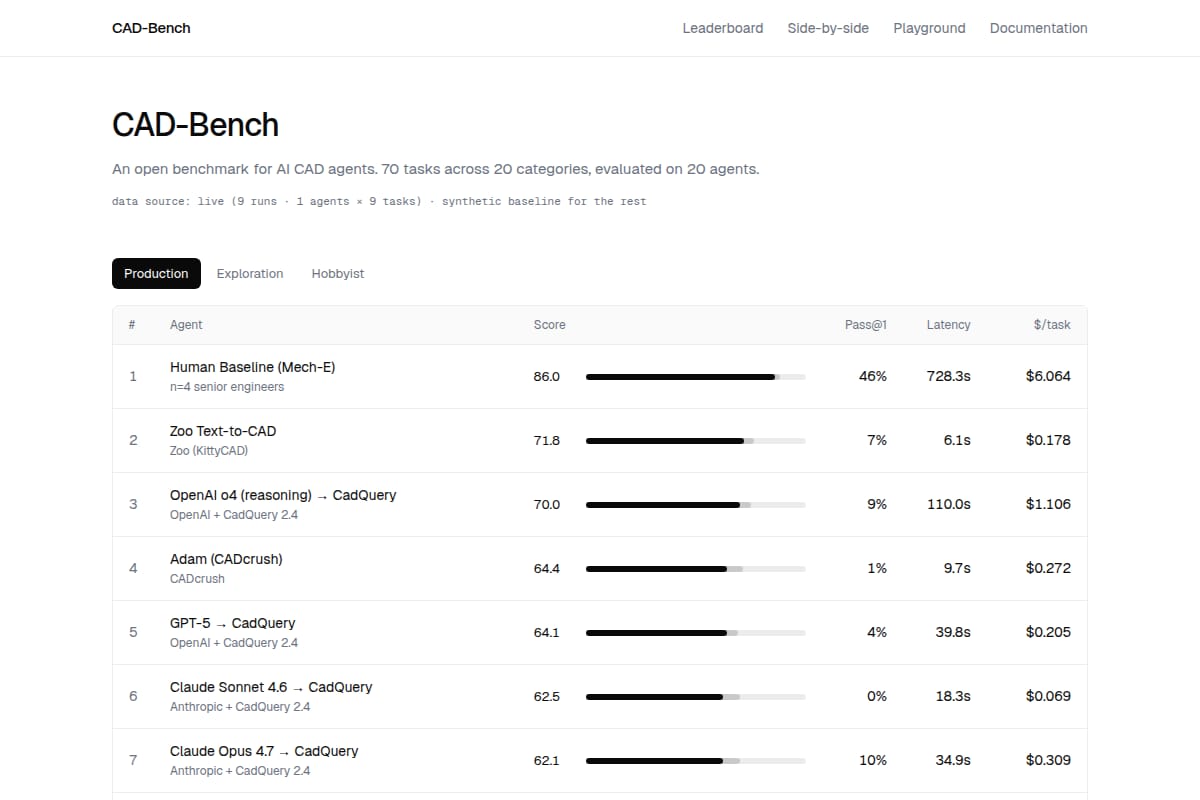
CAD-Bench screenshot
#163 CAD-Bench
88

Research / Knowledge Work

An open benchmark and leaderboard for AI CAD agents, with 308 prompts across 20 categories and layered scoring for geometry, engineering, manufacturability, and cognition.

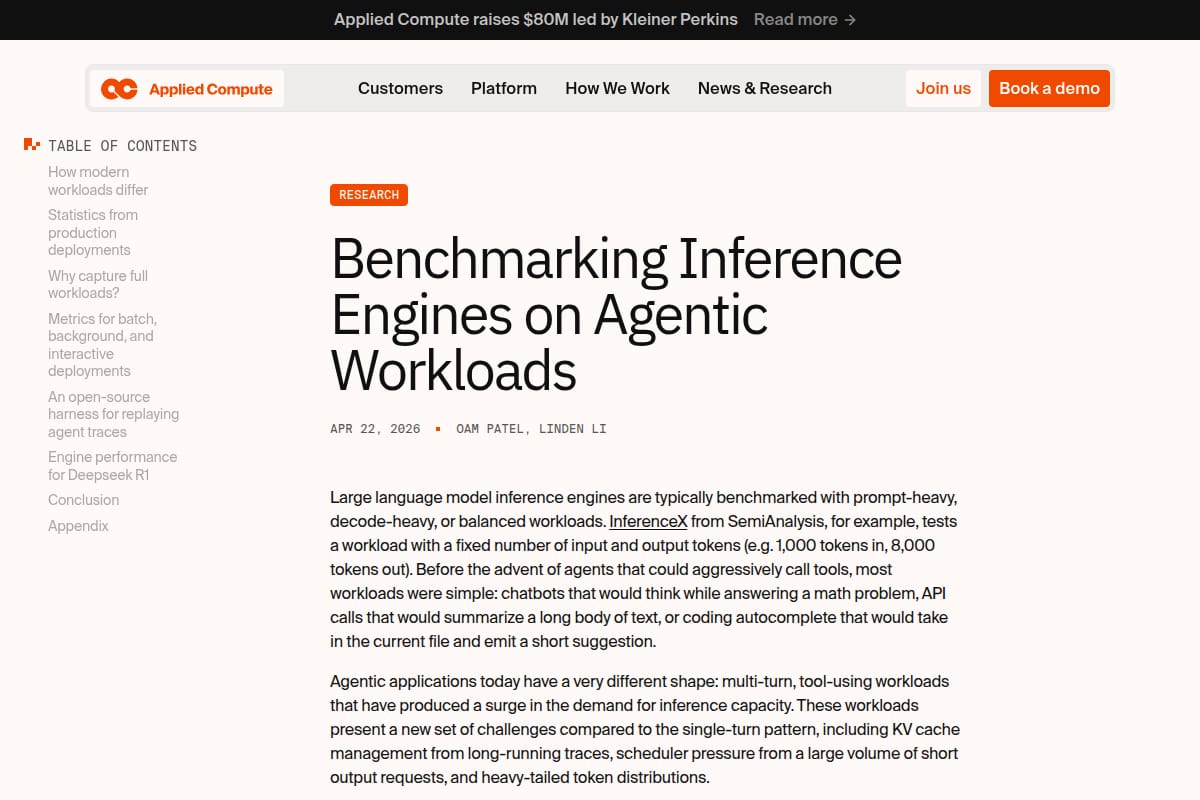
Benchmarking Inference Engines on Agentic Workloads screenshot

Research / Knowledge Work

A research article from Applied Compute on how agentic, tool-using workloads differ from traditional LLM benchmarks, with production observations, workload profiles, and an open-source harness for replaying traces.

UnderstandDocs screenshot
86

Research / Knowledge Work

UnderstandDocs is a document analysis tool that summarizes pasted text or uploaded files, flags risks, extracts important dates, and simplifies dense language. The page shows a working analysis form, supported file types, a privacy/no-storage claim, and an example output for a tenancy agreement.